
Your Step by Step Guide to Factor Analysis of Profit
Profit is one of the key performance indicators of a business. Whatever strategy a company is following, it is critical to understand what elements constitute its profit, what products or business units make the greatest contribution (both positive and negative), what distribution channels create more value.
Along with the current estimation of your profit from different perspectives, it is equally important to identify the reasons that have caused the changes over a period and led to this state, such as: the effect of promotional activities, new product launches, cost optimization and many other business initiatives. Hardly ever do we find ourselves in a situation of “an ideal experiment” in which only one factor has changed while other influences remained constant. In real life, multiple variables may affect the profit simultaneously making it hard to explain its evolution over time, find all the possible reasons and measure their impact.
But no need to worry since nothing is impossible with one of the most useful and widely adopted economic tool called FACTOR ANALYSIS! This article will discuss its general purpose and practical application. For rules of calculation check our second article from this series - “Becoming the Master of Factor Analysis of Profit: the Secrets of Calculation”.
Benefits of factor analysis
Often referred to as volume-mix-price analysis, it is indeed much more powerful and allows to perform a deep and structured analysis of profit revealing the insights and reasons behind the business’ success or difficulties. Factor analysis may serve a variety of goals, among which are the following:
Answer the question: Why has profit changed? Learn what factors affected profit the most, find products which are the main contributors or the destructors of profit.
Test the hypotheses about the influence of ongoing projects on profit, verify whether this impact corresponds to the preliminary estimates and expectations, then update the assumptions and timely modify the profit levers.
Determine what actions are to be taken to secure the desired profitability level and maximize profit.
Evaluate the future profit taking into consideration the effect of your planned activities and estimated values of macroeconomic indicators.
Ensure a more accurate forecast based on past results of factor analysis and current trends.
Develop business scenarios by quickly modifying profit parameters.
Practical application of factor analysis
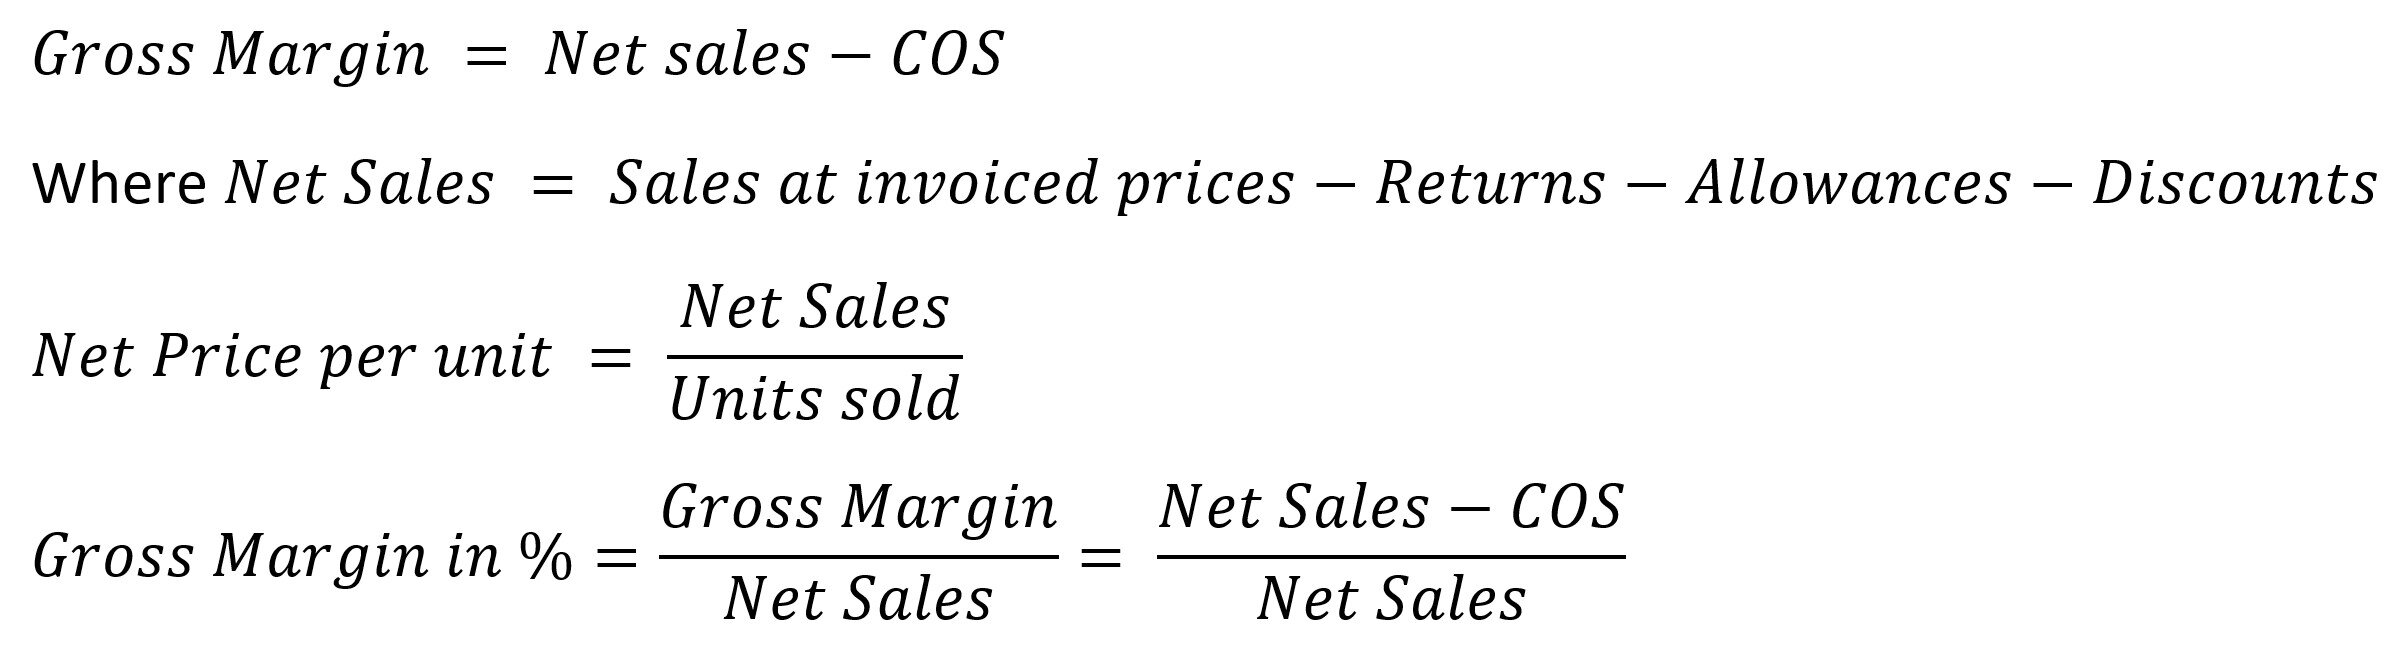
Before moving on to the practical application of profit factor analysis, it should be noted that by profit here we will consider the revenue remaining after deduction of all costs which can be allocated by product (i.e. excluding overheads, such as unused warehouse space or equipment, administration costs, etc.). While the process of allocating the costs is extremely important and often painstaking, followed by accepting certain assumptions and varied according to the industry, company or even the goal of the analysis, the discussion of this question lies beyond the scope of this article. More often this kind of profit is called “Gross Profit” or “Gross Margin” and is calculated as “Net Sales” (sales at invoiced prices paid by clients of a company minus returns, allowances and discounts, such as year end rebates) minus “Cost of Sales (COS)” or “Cost of Goods Sold (COGS)”. Next in the article we will use this terminology:
Factors determination
So, turning to factor analysis of gross margin, we start by determining the most important contributing elements. As an example of a gross margin decomposition, we present the following scheme (note: the list of factors mentioned below doesn’t pretend to be exhaustive in every case or relative to all businesses):
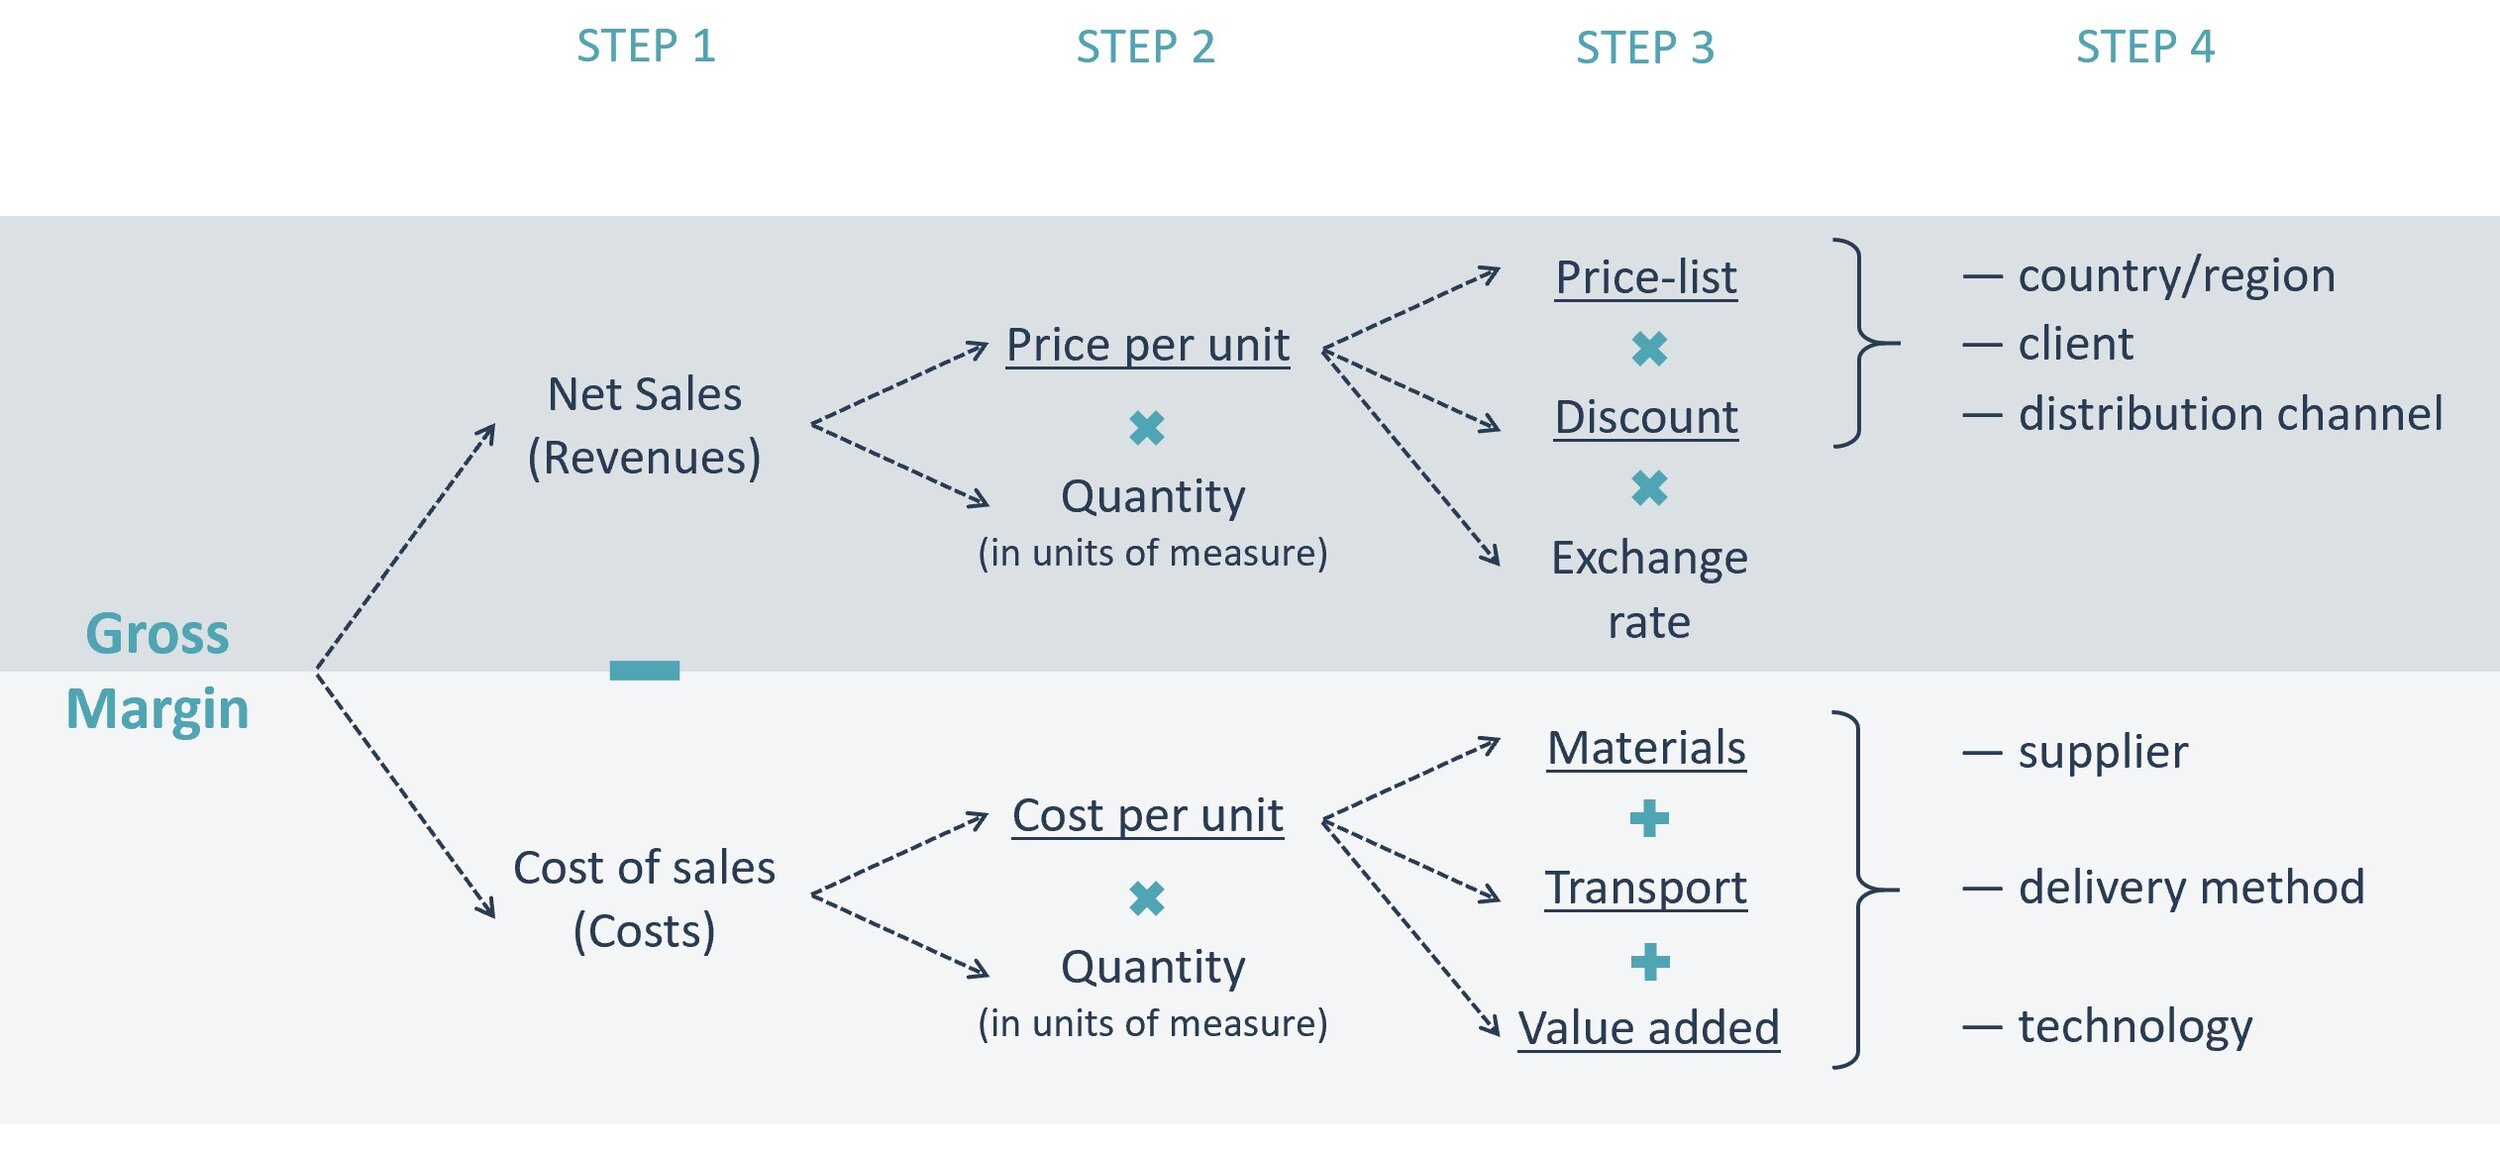
At step 1, it is obvious that gross margin (and its evolution over time) depends on the excess of the generated net sales over the related costs. At step 2, we continue by defining net sales and cost of sales as the multiplication of quantity in units sold by net price per unit and by cost per unit correspondingly. Now we can analyse the impacts of the following factors on gross margin:
volume effect: the change in quantities between the two analysed periods or the difference between plan and actual performance;
price effect: the evolution of net prices of the analysed product portfolio;
cost effect: the evolution of costs per unit of the analysed product portfolio;
product mix effect: the change of weight of each product in a portfolio.
The product (or assortment) mix will appear if there is more than one product in a portfolio and the quantity of at least one product sold has changed at a different rate than the others, which will mean that the structure of the portfolio has changed. The positive product mix on gross margin indicates that a business sold a greater proportion of profitable items compared to the previous period (or versus a plan), while the negative mix, on the contrary, informs that the share of less profitable items in the portfolio has increased.
It can be further analysed which products have brought the greatest impact on gross margin overall or in terms of each factor.
These four factors provide a solid base for margin analysis, however, the evolution of net prices and costs often requires a closer look inside and a more detailed explanation of the reasons behind these changes.
Thus, net prices can be represented as the result of application of various discounts to the list prices. List prices deductions may be in a form of distribution discounts, include promotional activities and motivational bonuses for the achievement of business objectives. At step 3, we can calculate separately the effects due to the price-list change and due to the variations of the given discounts.
Moreover, if a business is international then fluctuations of exchange rates may cause a significant impact on prices and, therefore, on profits.
As for cost of sales, the total costs can be further decomposed into components: raw materials, transport and logistics charges, value added, etc.
At this stage, we have determined some of the most influencing factors.
It should be noted, though, that the prior steps are based on the analysis of gross margin, net sales, prices, etc. aggregated per product, by which we assume that, for example, if a company sells products to several customers, then in our calculation we have considered the average (between all customers) price of each product. So, we can retrieve more details by adding other levels of classification (besides a product level) to factor analysis of gross margin, i.e. prices and/or discounts may vary enormously by customer, region/country, distribution channel, while costs may fluctuate because of the different mixes of suppliers, delivery methods, etc. So may vary the shares of customers/ regions/ channels/ suppliers/ delivery methods, which is the reason why it may be essential in some cases to measure the effects of all these variations (Step 4).
To give an example (based on a “manufacturer to distributor” business relationship): if more units of a certain product are sold to customers who have better selling conditions (that is, higher discounts), then we’ll face a negative customer mix effect on gross margin.
Method
Having defined a list of possible factors affecting gross margin, we turn to the calculation of effects, which can be measured in:
values (e.g. volume effect represents X euros);
percentage points (e.g. margin percentage has changed by X pts due to mix effect).
It should be added that factor analysis, besides being applicable to gross margin, can also identify the impacts of factors separately on sales and on cost of sales (COS). In this case the effects are measured in:
values (e.g. volume effect on sales represents X euros);
percentages of growth (e.g. net sales have increased by X% due to price increase).
When comparing the corresponding effects calculated separately on sales and on cost of sales (such as volume and mix effects on sales versus on COS or price/unit versus cost/unit effects), we can infer whether the gross margin has increased or declined due to these factors. If the value of the effect on sales exceeds the value of the corresponding effect on COS, then the gross margin in value grows, if it is less – the gross margin value decreases. The same statement is true for estimating the impact on margin in percentage points: it is positive when the growth rate of sales effects is higher than that of COS and it is negative when the growth rate of sales effects is lower.
Below is the visualization of factor analysis of sales, COS and gross margin using four factors: volume, product mix, price, cost/unit (the right charts - in values, the left charts – in percentages/ percentage points). The example is based on hypothetical data. If the combination of corresponding effects results in the positive impact on gross margin (= if the effect on sales is greater than the effect on COS), then the total column with the effect is highlighted green, if the impact is negative – then the total column is highlighted red. The bottom charts in the example contain the initial gross margin at the period N-1 (in value and in percentage of net sales), the effects (in values and in percentage points) and the final gross margin at the period N).

The rules of calculating these effects and the detailed interpretation of the results will be thoroughly discussed in the next article dedicated to factor analysis of profit, while here let us briefly describe that the gross margin has grown both in value (+41 k€) and in percentage points (+1,4 pts) despite the decrease in volume (-8%) and in sales (-2,2%). This growth has been achieved thanks to the positive mix effect – due to the greater share of more expensive items which are more profitable (the total growth of sales +7,3% significantly exceeds the total growth of COS +1,2%, resulting in +4,1 pts increase of gross margin in %). The overall declining rate of cost of sales (-4,1%) is slower than the declining rate of sales (-2,2%), which has led to the improvement of gross margin in %.
The bottom charts in the example represent the most common diagram to illustrate factor analysis of profit, which is often called “waterfall” or “bridge”.
Such visual presentation perfectly corresponds to the core idea of factor analysis – explain the transformation from one state to another sequentially or step by step; in other words, construct the bridge linking transitional stages to lead from a departure point (N-1 in the example above) to a final destination (N). The “height” of each step (effect) corresponds to the evolution of only one factor being currently considered, and with each new step the amount (or percentage) of profit transforms into the new value, acting as a base for the following step, until the profit reaches its final value.
To summarize, the decomposition of profit into factors allows to understand the reasons behind profit’s changes, take timely actions to prevent a business from a dangerous financial state, ensure the profitability of future projects. Factor analysis reveals the sources of profit maximization down to the grass roots, be it a product, a client, a distribution channel…
Estimating the effects of the evolution of sales and cost of sales in percentages brings even more insights. In a general sense, these percentages provide a global view of how volume / prices / costs have changed for a portfolio of products / clients / etc., and they can be further used in profit forecasts and scenario simulations, for example, to estimate the necessary global price increase to cover the increase of costs or the minimum volume growth to gain profit from promotional activities.
Related reading:
Part 2: “Becoming the Master of Factor Analysis of Profit: the Secrets of Calculation”
To learn about how not to lose a profit while offering sales promotions and how much the sales should grow to cover price reductions, you can read our article “How (Not) to Lose a Profit in 10 Days” or go straight to the Profitability Calculators to simulate your new profit.