How (Not) to Lose a Profit in 10 Days?
Promotions are very popular among marketers and businesspeople who aim to boost sales, foster brand awareness, reward their customers, attract attention to the new collection born to conquer the world and so on.
Promotions may take multiple forms among which are various discounts and price reductions, and, as a result, not only your volumes and sales get affected but most importantly – your profits. That is why not a single selling action will escape from the sight of the guardians of your company’s well-being – the finance function.
If you are one of those business enthusiasts willing to offer the best products and services at unbelievable prices to their dearest customers, then you might have at least once been opposed by the finance professionals vetoing your project.
So, if you always want to hear “YES” from your finance team or from your inner voice (in case of nurturing a start-up on your own), then this article is for you. Here you will learn how sensitive is your profit to changes of sales volumes, variations of prices and costs, and how to develop promotional activities allowing to multiply sales revenues while creating gains instead of losses. Also, by this article we introduce our profitability calculators which help to measure the impact of these changes and make necessary adjustments to secure the desired level of profit.
What Is Profit and How Can It Be Measured?
Before we begin, let us introduce the terminology used in this article. We will consider three indicators of profit:
1) “Gross Profit or Gross Margin” (referred to as “Profit”) – is the amount of revenue remaining after deducting the cost of goods sold (referred to as “COGS”), which is measured in values (e.g. in euros or in any other currency).

2) “Profit per unit” – indicates how much profit the sale of one product generates and is also measured in values. When multiplied by the number of units sold, it will result in the total amount of profit for this product.

3) “Profit in % of Net Sales” or “Profitability Rate” (referred to as “Profit in %”) – represents how much profit each euro (or any other currency) of net sales brings and is usually measured in %. As an example, 20% profit means that a business generates 20 cents of profit from each 1 euro of net sales.

Similar, Yet So Different
To discover what insights each of these indicators can provide, let’s have a look at 3 examples below (Table 1).
Table 1

For simplicity let’s assume that in each example we have 3 products: A, B and C. In real business case A, B and C may represent product lines, business units or even 3 different companies.
In all 3 examples the total profit equals 100€ for each product, however, the story behind this amount is completely different. Another common feature is the profitability rate of products: in each example product A is the least profitable with 10% profit, product C is the most profitable with 50% profit, and product B is in between them with 25% profit. This means that product A generates 10 cents of profit from 1 euro of net sales, B – 25 cents and C – 50 cents.
Example 1: All 3 products are sold at the same price (=10€ per unit) but costs and sales volumes differ. Thus, to get 100€ of profit it is necessary to sell 100 units of product A bringing 1€ profit/unit, or 40 units of product B with 2,5€ profit/unit, or 20 units of product C with 5€ profit/unit.
From this example it can be concluded that:
Given equal prices, the higher the cost per unit, the lower the profit per unit and the profit in %;
Given equal prices, the higher the cost per unit, the greater should be the number of units sold to get the same profit amount.
Examples 2 and 3: Here we would like to pay your attention to the indicator “profit per unit” and emphasize that it should not serve as a basis for determining the most profitable product, that is, the product bringing the highest profit from each euro/dollar/… of sales. In Example 2 profit per unit is the same for all 3 products (=1€), but still each product has different profitability – 10%, 25% and 50%. In Example 3 the product with the lowest profitability rate (A) has the highest profit/unit (=2,5€), while the product with highest % of profit brings only 1,75€ of profit/unit.
Only in Example 1 the highest profit per unit belongs to the product with the highest profit in %, hence:
The product with the higher profit per unit doesn’t necessarily generate the higher profit per euro/dollar/… of sales.
Now it’s time to uncover what happens to your profits when volumes, prices or costs change, and what is the impact of your profitability rate (profit in %) on how fast you can win or lose.
What Happens to Profit and Why Profit in % Matters?
Let’s focus on Example 2 from the previous chapter (Table 1) in which all three products A, B and C currently bring an equal profit of 1€ per unit, or 100€ in total for 100 units sold of each product.
So, what will happen to profit if you decide to modify prices, give additional discounts, or if your suppliers adjust the prices of materials used to produce these products, or the manufacturing process and the associated costs change?
!!! Note that all the following explanations and conclusions are true when profit at the beginning is positive.
What will make your profit grow?
First, we’ll consider factors driving positive changes on profit:
Increase of volume;
increase of price;
decrease of cost.
In Table 2 we demonstrate how profit from our example will change:
if volume increases by 10% for each product;
or if prices increase by 10% for each product;
or if costs decrease by 10% for each product.
Table 2

If volume increases by 10%:
As you can see from Table 2, net sales, cost of goods sold and profit in values will grow by 10% following volume increase, while profit in % and profit per unit will remain unchanged.
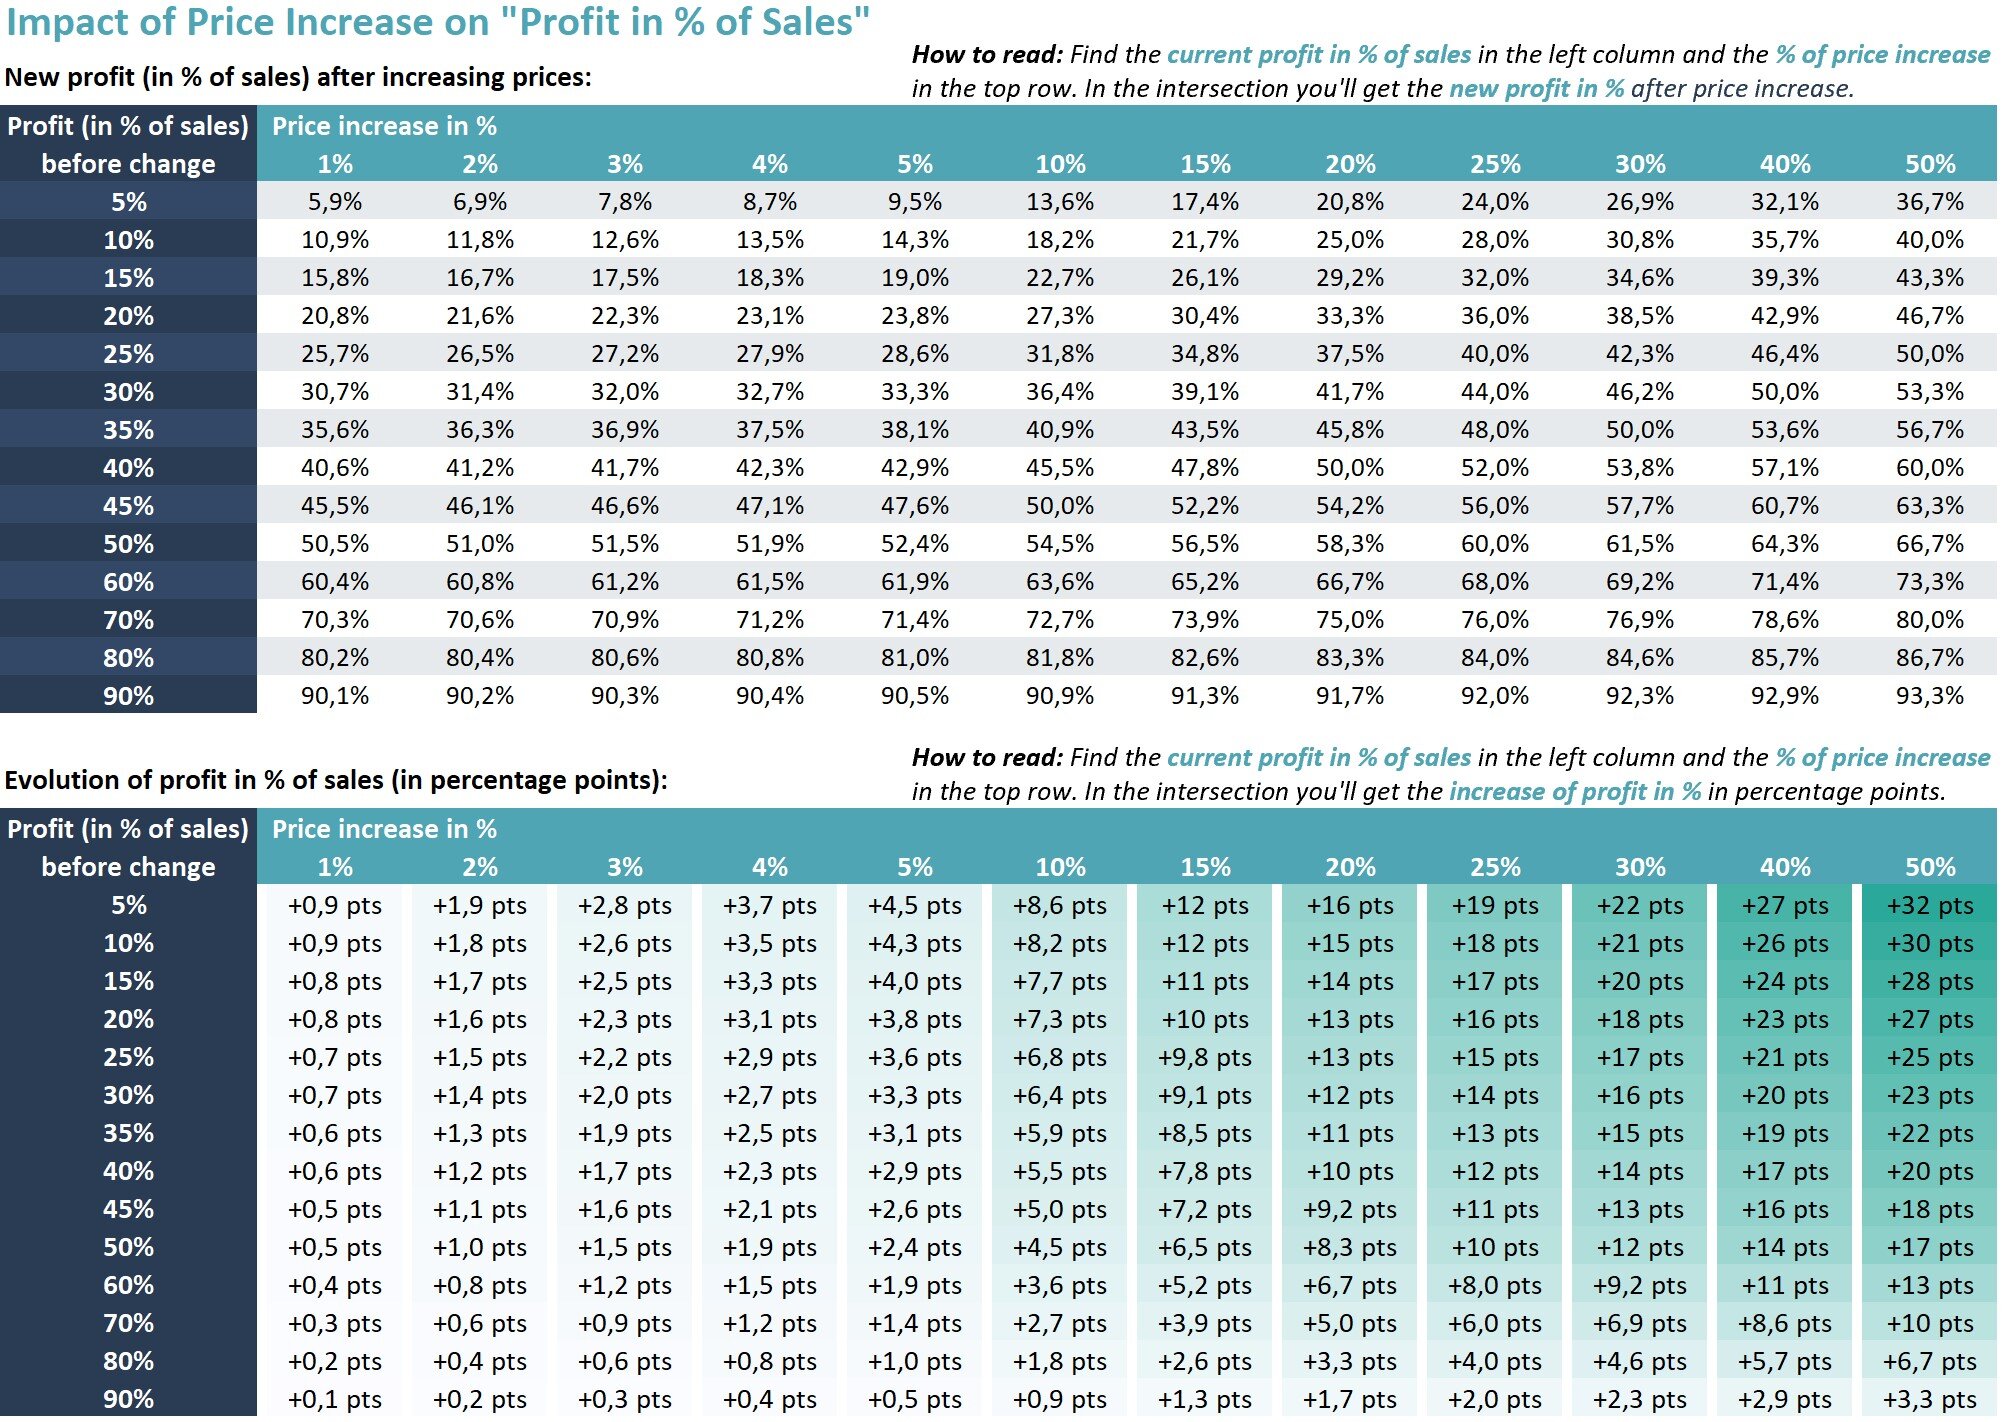
If prices increase by 10%:
For product A profit in values will double (+100%) and reach 200€ thanks to the price increase by only 10%. Profit per unit will double as well (up to 2€), while profit in % will grow by 8,2 points (=18,2% – 10,0%).
For product B the 10 percent increase of price will bring considerably less profit: +40€ or +40% (against +100€ or +100% for product A), +0,4€ or +40% of profit per unit, and +6,8 points of profit in %, while for product C the change is even slighter: only +20% for total profit and profit/unit and +4,5 points for profit in %.
To summarize:
The higher the profit in %, the slighter is the impact on profit from price increase.
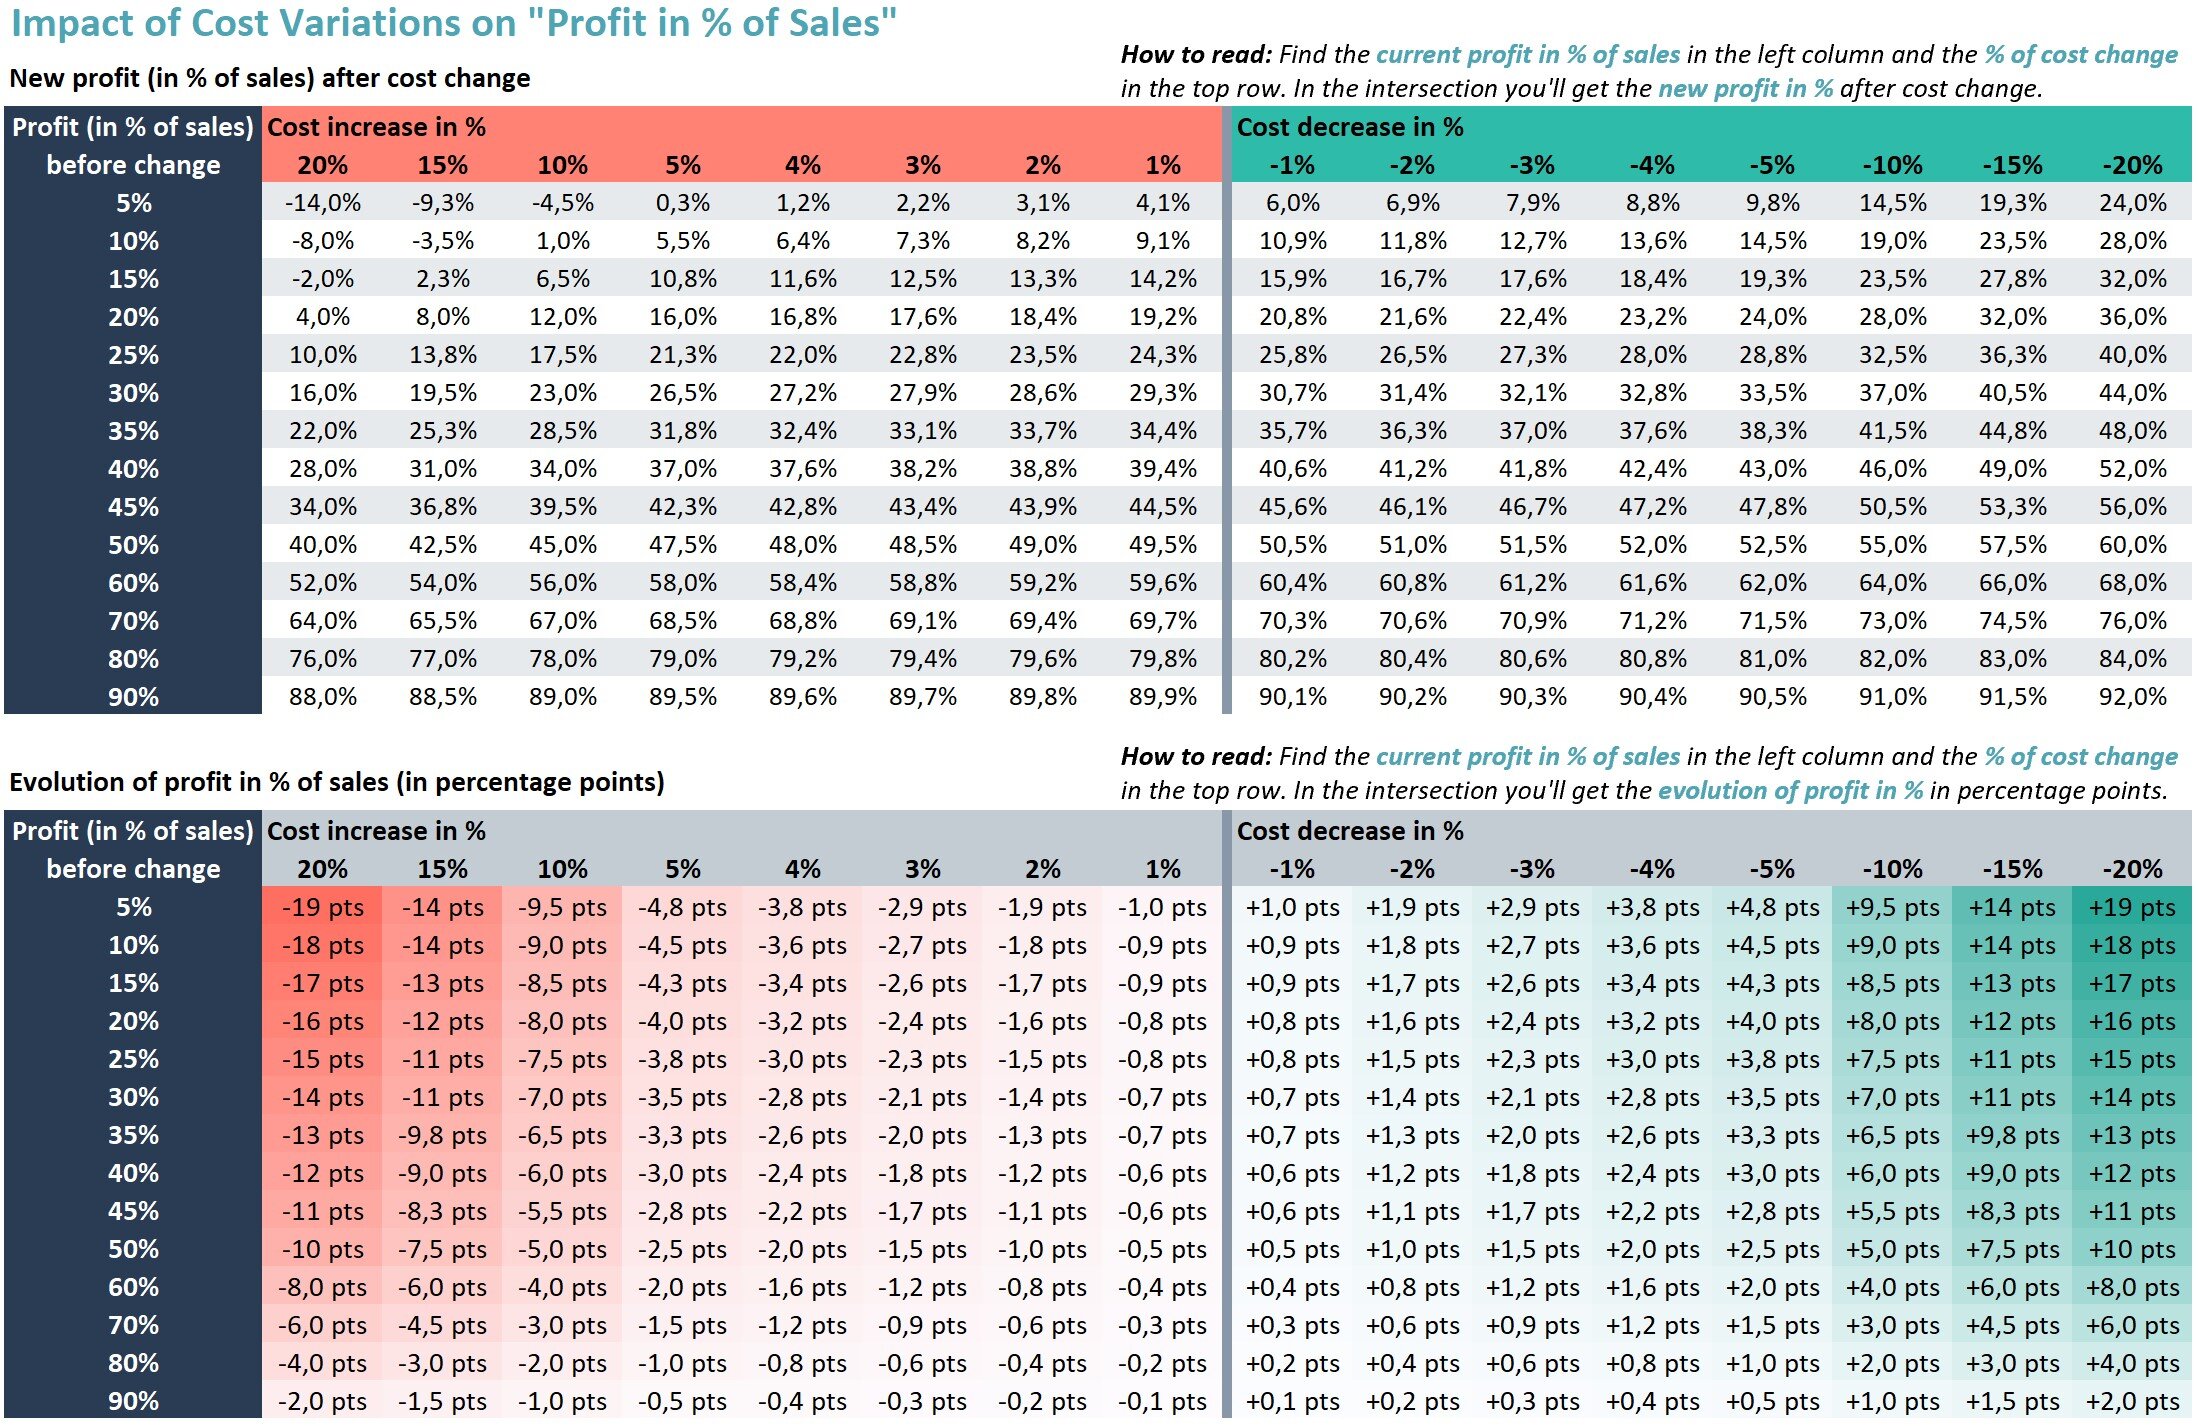
If costs decrease by 10%:
It will also be true to say that if we decrease costs by the same percentage for each product, profit in values will grow at a faster rate for products with lower profit in %. Thus, the product with the lowest profit in % (A) has witnessed the greatest profit increase: total profit and profit/unit have grown by 90%, while profit in % - by 9 points to reach 19%.
It should be noted that when comparing the impact on profit from price increase versus cost decrease by the same percentage (10% in our example), price increase creates more profit in values than cost decrease:
Product A: 200€ vs 190€, or +100% vs +90%;
Product B: 140€ vs 130€ or +40% vs +30%;
Product C: 120€ vs 110€, or +20%/+10%.
It’s not a coincidence that the difference of profit growth is 10% for each product (100% - 90% = 10%, etc.) – that is the percentage of the applied price increase / cost decrease.
On the contrary, cost decrease generates more profit in % than price increase by the same percentage (A: +9 pts/+8,2 pts, B: +7,5 pts/+6,8 pts, C: +5 pts/+4,5 pts).
To summarize:
The higher the profit in %, the slighter is the impact on profit from cost decrease;
Given equal percentages of price increase and cost decrease, price increase creates more profit in values, while cost decrease generates more profit in %.
What will put your profit in danger?
Your profit can go down due to:
decrease of volume;
decrease of price;
increase of cost.
In Table 3 we demonstrate the loss of profit due to the opposite scenario to the one we have just seen:
if volume decreases by 10% for each product;
or if prices decrease by 10% for each product;
or if costs increase by 10% for each product.
Table 3

If volume decreases by 10%:
Net sales, cost of goods sold and profit in values will drop by 10% following volume decrease, while profit in % and profit per unit will remain unchanged.
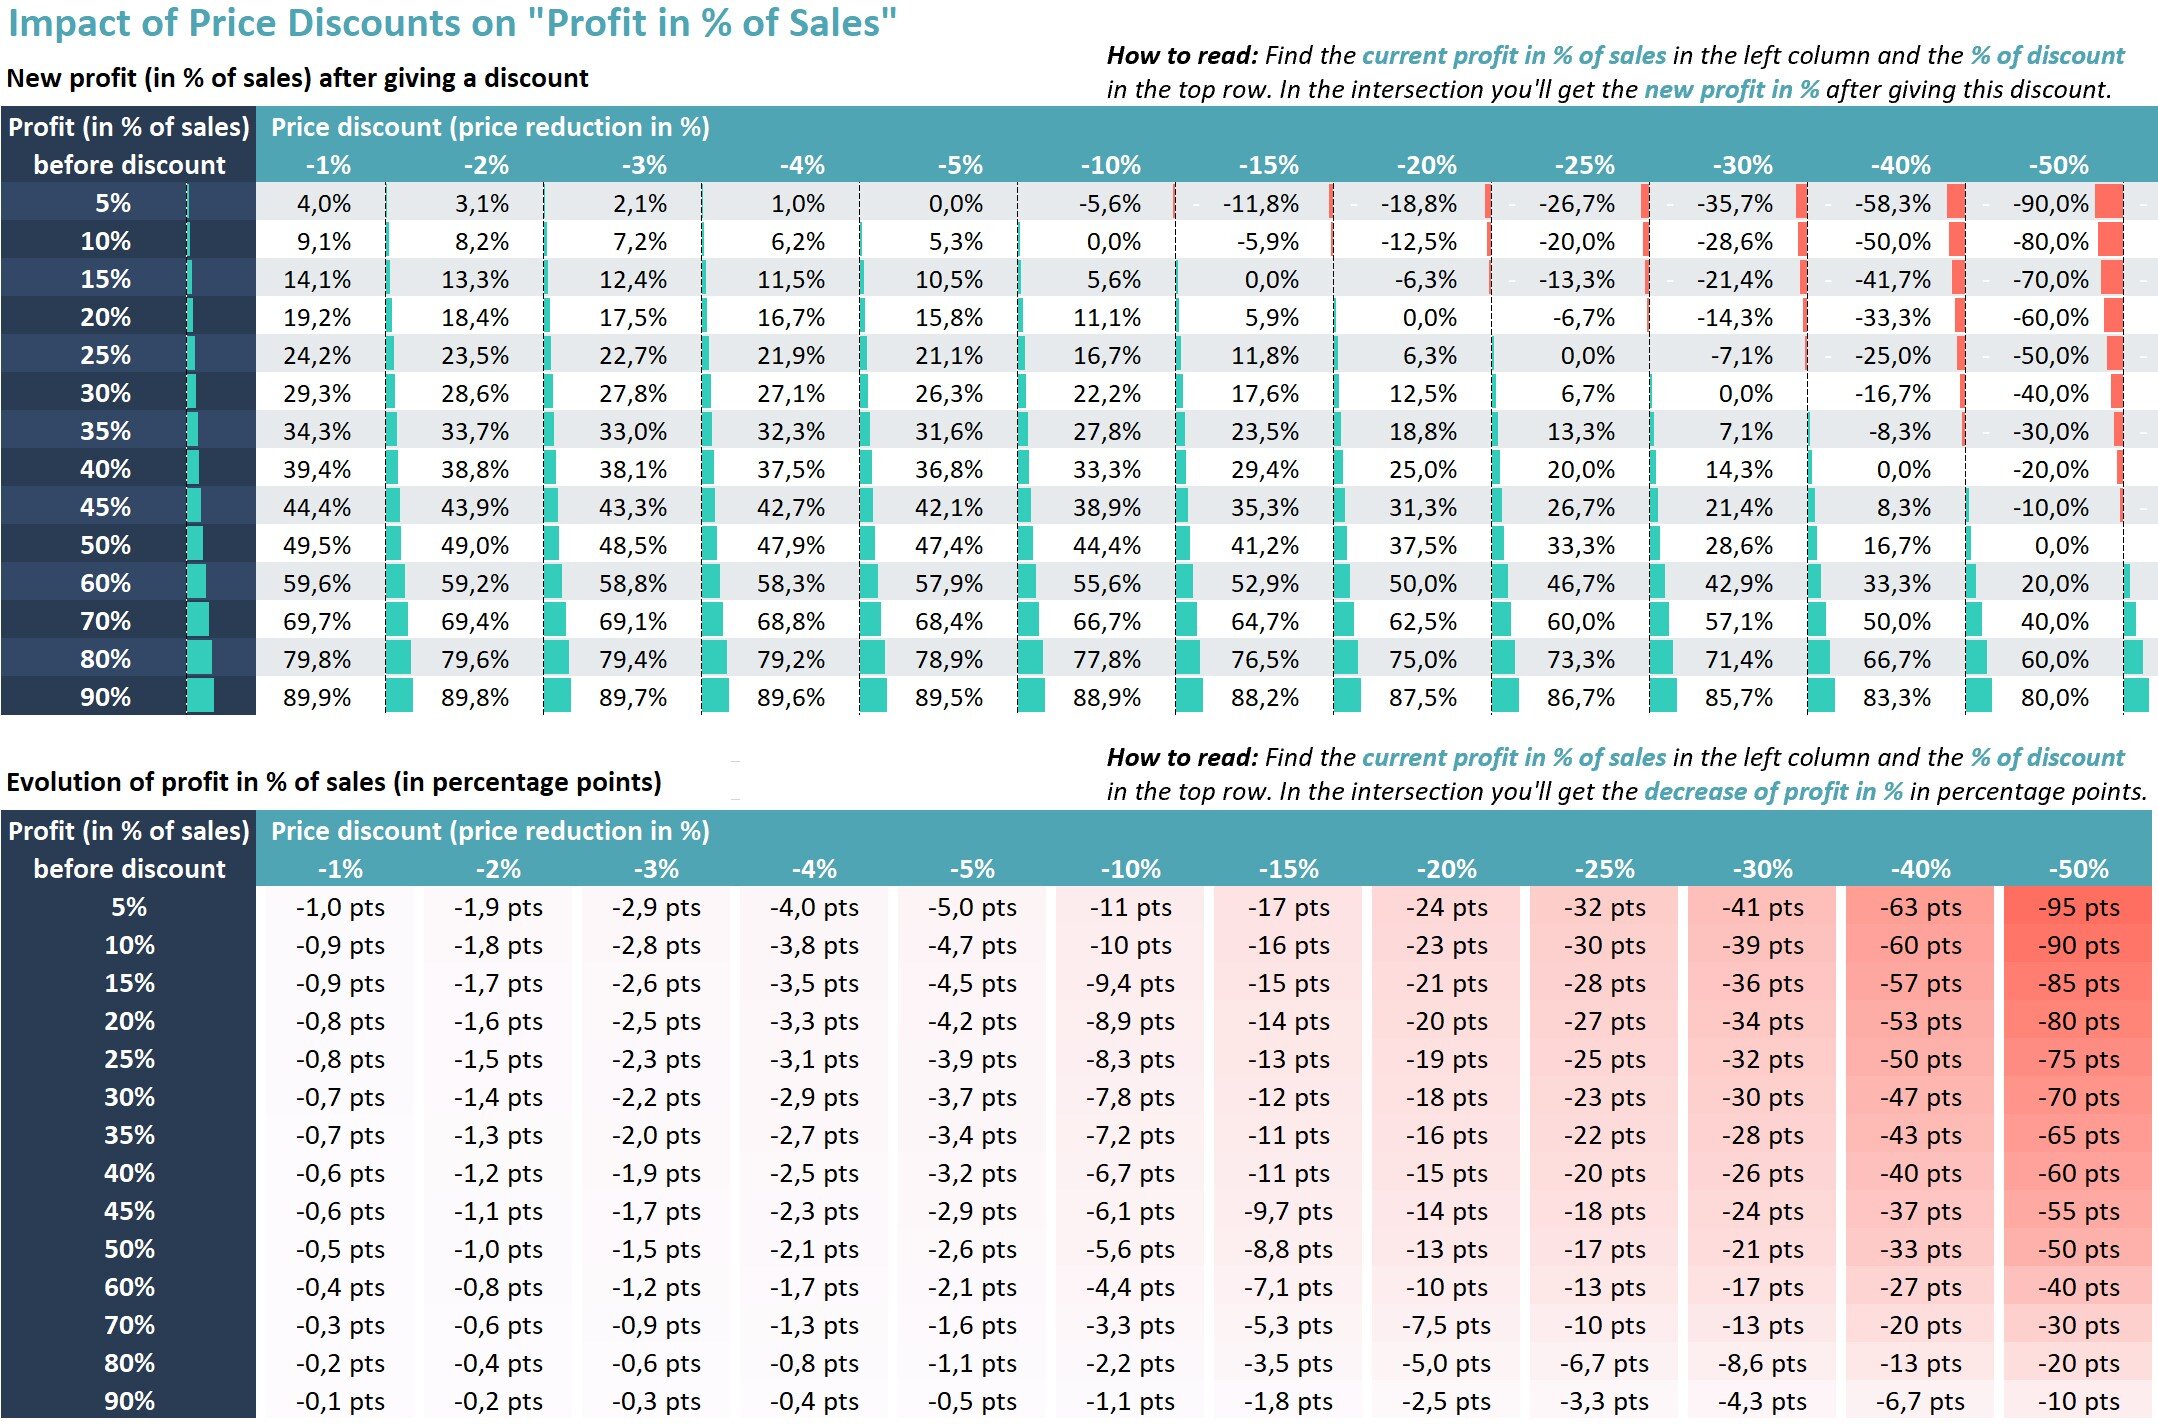
If prices decrease by 10%:
Looking back to the previous example of price increase by 10% (Table 2), here we get the same percentages of profit change in values for all 3 products but with the opposite sign.
Attention to product A with the initial 10% profit: the reduction of price by only 10% will lead to the complete destruction of profit since it will become 0 (losing 100€, or -100%). The further price decrease of this product will result in negative profit (= loss). Product B will lose 40€ (=100€ - 60€), while product C will lose only 20€.
So, we can draw a parallel between the speed of profit change and the initial profit in %:
The lower the profit in %, the worse is the impact on profit from price decrease.
If costs increase by 10%:
The increase of costs by 10% has a slightly lesser negative effect on profit than the decrease of prices by 10%. Thus, product A will keep some profit, that is 10€, or 1%. Product B will lose 30€ of profit, product C will lose 10€. The percentages of profit decline are equal to those from Table 2 with the opposite sign.
To summarize:
The lower the profit in %, the worse is the impact on profit from cost increase;
Given equal percentages of price decrease and cost increase, price decrease causes the greater loss of profit, both in values and in % points.
Will profit change if both prices and costs increase (or decrease) by the same %?
Well, the answer is “Yes” and “No”.
In Table 4 we illustrate what will happen:
if prices and costs increase by 10% for each product;
or if prices and costs decrease by 10% for each product.
Table 4

“Yes” – Profit and profit per unit will change.
Increasing prices by 10% following the growth of costs by 10% will rise your profit and profit per unit by 10%. In contrast, decreasing both prices and costs by 10% will reduce your profit and profit per unit by 10%. These statements are true for all 3 products.
“No” – Profit in % won’t change.
The level of profitability (profit in %) won’t change if the increase (or decrease) of costs is compensated by the same percentage of price increase (or decrease).
To summarize:
Given equal percentages of price and cost increase, profit in values will grow by this percentage, while profit in % will remain constant;
Given equal percentages of price and cost decrease, profit in values will drop by this percentage, while profit in % will remain constant.
In summing up the discussion of three indicators of profit, we should emphasize the great importance of “Profit in % of Net Sales”. Unlike “Profit” and “Profit per unit” expressed in values, “Profit in %” is a relative indicator representing the key metrics of a company’s efficiency. Moreover, it determines the sensitivity of profit to variations of prices and costs.
“Profit per unit” can be useful in some cases, but it should not be considered as the measure defining the most or least profitable product. As we have demonstrated in Example 3 from Table 1, the product with the highest profit per unit may have the lowest profit in %, which means that even a slight rise of cost puts at risk the very existence of profit.
Finally, “Profit” is the most essential indicator – the one that any for-profit organization seeks to maximize, which, depending on a business strategy, can be achieved, for example, by multiplying the number of units sold or by increasing the profitability of products.
Key takeaways:
The lower the profit in %, the more sensitive is profit to variations of prices and costs;
Given equal percentages of change, the evolution of prices has a stronger influence on the amount of profit than the evolution of costs;
The simultaneous growth of prices and costs by equal percentage will increase the amount of profit and profit per unit (by this percentage), while the simultaneous drop of prices and costs will decrease the amount of profit and profit per unit (by this percentage);
The profit in % will remain constant provided that prices and costs change by equal percentage.
!!! Reminder: all the statements are true when profit at the beginning is positive.

Now, having considered the correlation between variations of prices, costs and profits, let’s practice with two simple business cases.
Business Case 1: How to Double Your Profit?
Case description: The business sets an objective to double the amount of profit. How can this growth be achieved?
Again, as a starting point we take Example 2 from Table 1 with 3 products A, B, and C, characterised by equal quantities, amount of profit and profit per unit, but with different prices, costs and profit in %.
Table 5

To double profit (from 100€ to 200€) for these products several actions can be taken (see Table 5):
1) Volume: double the number of quantities sold
In Table 5 we see that in this case net sales, COGS and profit will double (grow by 100%) for all 3 products. Since neither prices nor costs per unit change, profit per unit and profit in % will remain constant.
2) Prices: apply necessary price increase
As these 3 products have different profitability (profit in %), the percentage of price increase necessary to grow profit by 100% varies significantly. For product A it’s enough to increase price by 10% to double profit, for product B – by 25% and for product C – by 50%.
Note: Net sales will increase by the same percentage as price. Profit per unit will double.
Interesting tip: to increase the amount of profit by 100%, the price should go up by the percentage equal to profit in % before change (10%, 25%, 50% for A, B, C correspondingly). Or, broadly speaking:
To get an X-fold increase of profit (X is a coefficient greater than 1, e.g. X=1,2 means the increase of profit by 20%), it is necessary to increase prices by (X-1)*profit_in_%*100%
3) Costs: search for opportunities to reduce costs
To double profit, costs should decrease by 11%, 33% and 100% for products A, B and C correspondingly – that is something not easy to do.
Note: It’s impossible to double your profit by only reducing costs if profit in % is equal or higher than 50%, because it means that it would cost you nothing or a negative amount to produce and sell this product.
4) All the above: consider any combination of options above that best suits your current situation
Business Case 2: How to Gain Profit by Giving Discounts?
Case description: The business plans to implement a 1-week sales promotion in the form of a 10% discount aiming to enhance sales. How much units should be sold to grow the amount of profit by 20%?
We continue to use Example 2 from Table 1. So, the company currently sales 100 units per week of product A, B and C earning 100€ profit for each of them (see Table 6).
Table 6

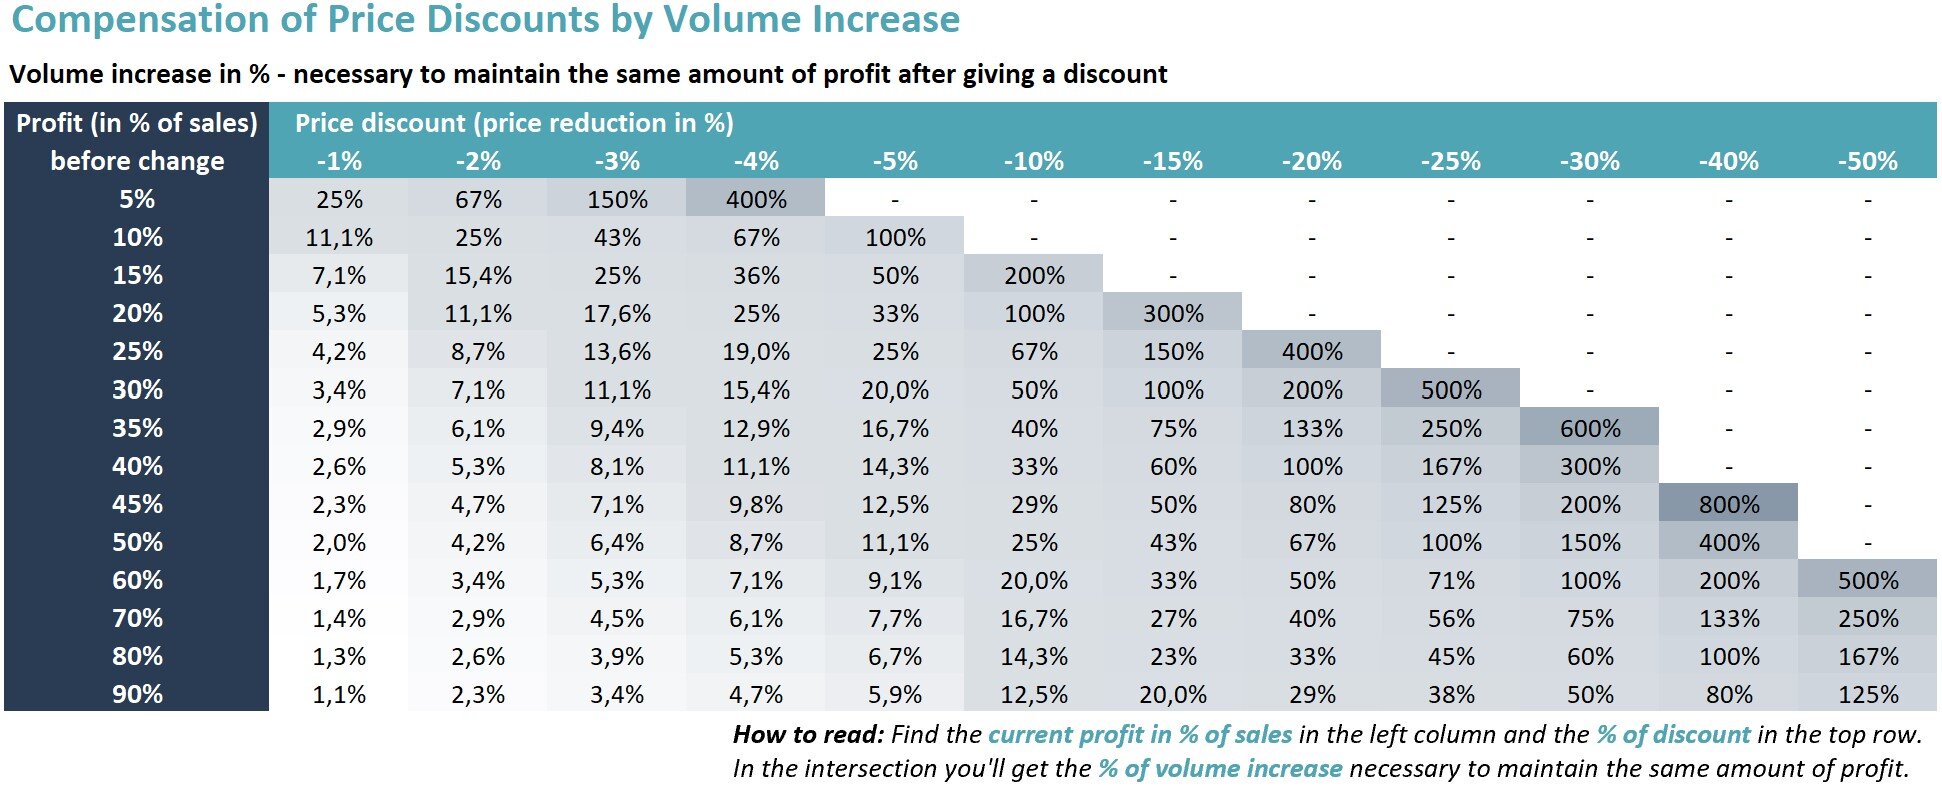
Giving a 10% discount means reducing prices by 10%.
Scenario 1 (Loss of profit): If no additional volume is sold, then the business will lose 10% of net sales and different percentages of profit amount depending on the product’s profitability (as we have already demonstrated in Table 3 of the previous chapter). The profitability (profit in % of sales) will decrease as well.
Scenario 2 (Equal profit): In this scenario we show how many units should be sold to secure the same amount of profit as in the ordinary week without sales promotion. For product A the profit will become zero after applying a 10% discount, and it will remain zero no matter how many units are sold. As for the rest of the products, to get the same 100€ profit it is necessary to sell 67 more units of product B (or +67%) and 25 more units of product C (or +25%).
Scenario 3 (Profit +20%): Finally, our response to the case’s task of increasing profit by 20% while providing a 10% discount is following:
Product A: it’s not possible, because the discount provided should be less than the profitability of the product (profit in % of sales) to gain profit.
Product B: The number of units sold during promotion should double (from 100 to 200 units).
Product C: The number of units sold during promotion should increase by 50% (from 100 to 150 units).
Note that each product has lost several points of profitability due to the promotion, which was compensated by higher volume to achieve the total growth of profit amount.
We hope that this article has shed light on profit sensitivity and will help you in searching for profit maximization, planning sales promotions or negotiating selling conditions with your clients. To quickly evaluate the impact of variations of prices and costs on your profit we have prepared several tables which can be found below in the gallery and can be downloaded here or by clicking the button “download tables” at the end of this article.
We have also developed an online tool enabling you to customize each of the parameters to measure how your profit and profitability change. You can access our free tool through this link or from our menu “Tools”.
For your convenience these tables and profitability calculators are available in Excel file (created in MS Office 365 - check for compatibility), which can be downloaded here. Feel free to use this file in your projects and customize it to your needs.