
Becoming the Master of Factor Analysis of Profit: the Secrets of Calculation
In the introductory article to the factor analysis of profit, we discussed the benefits and objectives of this economic tool, its importance for understanding how your business performs and deciding in which direction it should evolve. Having taken a close look at the variety of possible influencing factors and the necessary steps to determine them, now we turn to the calculation details and the interpretation of the results.
This article will cover the most essential aspects and nuances of decomposing your revenues and expenses into price, volume, assortment mix, material cost change and other contributions. You will be able to define profit drivers and killers, find the reasons behind gains or losses, and transform your business performance into meaningful insights. Get ready to become the Master of Factor Analysis!
Before we start
First, let us introduce the terminology that we use:

Contents
Decomposition into factors is most frequently applied to explain the variances of sales, costs, gross margin and gross margin in %.

Referring to the scheme of factors determination above (described earlier in the introductory article), in Part 1 of this article we will explain how to calculate the impacts of volume, assortment mix, price and cost on the evolution of gross margin (corresponds to STEP 2 of the scheme), and in Part 2 we will go further by breaking down net prices into list prices and discounts, and costs – into materials and value added (STEP 3 of the scheme).
We will start each part by decomposing the evolution of net sales into factors (in values and in %), moving to the evolution of cost of sales (in values and in %), and, finally, – the evolution of gross margin (in values and in percentage points). Also, we will calculate the contribution of each product to the total evolution of gross margin.
Part 1
The evolution of net sales (3 factors): volume, assortment mix, net price
The evolution of cost of sales (3 factors): volume, assortment mix, cost per unit
The evolution of gross margin (4 factors): volume, assortment mix, net price, cost per unit
General formulas (unlimited number of factors)
Part 2
The evolution of net sales (4 factors): impacts of volume, assortment mix, list price, price discount
The evolution of cost of sales (4 factors): impacts of volume, assortment mix, material cost per unit, value added cost per unit
The evolution of gross margin (6 factors): impacts of volume, assortment mix, list price, price discount, material cost per unit, value added cost per unit
We recommend studying the Excel file accompanying this article for better understanding. It was created in MS Office 365 (check for compatibility) and can be found here and at the end of the article.
Further text will be entirely practical and will contain formulas to explain the calculations demonstrated in the Excel file.
Examples
Below are 4 examples based on hypothetical data (sheet “Examples” in Excel file)
Table 1

Each example consists of 2 products A and B and shows initial values (number of units sold (qty), net prices, and costs – Ex.4) at the period N-1, and the evolution of these values (in % or in percentage points) at the period N versus N-1.
PART 1
FACTOR ANALYSIS OF NET SALES
Let’s start by calculating the impacts of factors on net sales. Below are the solutions for Examples 1-3 (sheet “Part1_Sales” in Excel file).
Table 2

As you can see in Table 2, these examples represent the simplest situations with only one influencing factor.
Example 1. Volume effect
Total volume (quantities sold) has increased by 20 units and by 10%. Mix of products hasn’t changed, since the shares of products A and B are the same in both compared periods N-1 and N, or, in other words, products A and B have grown in quantities by the same percentage +10%. Prices of products A and B remain constant.
Net sales have grown by 120 € and by 10% due to volume effect. Average net price hasn’t changed.
Example 2. Mix effect
Total volume variance is equal to 0 (200 units in N-1 versus 200 units in N), so we can say that volume hasn’t changed. Prices of both products are also the same in 2 periods. However, net sales and average net price have increased because the shares of products A and B have changed (from 50% to 57,5 % and from 50% to 42,5% correspondingly).
Net sales have grown by 120 € and by 10% due to mix effect. Average net price has grown by 0,6 € and by 10%.
Example 3. Price effect
Here quantities remain the same for both products, so, there is neither volume nor mix effect. Only prices have increased by 10%.
Net sales and average net price have increased by 10% due to price effect.
Volume/Mix/Price effects (Example 4)
Such examples 1-3 are very rare in reality, in most cases we deal with numerous factors. Next, in Example 4 we will analyse all 3 factors (volume, mix and price) influencing the evolution of net sales (sheet “Part1_Sales” in Excel file).
Table 3

In Table 3 we see that total quantities have increased by 10%, shares of products A and B have changed (from 50% to 56,8% and from 50% to 43,2% correspondingly), prices of both products have also changed. As a result, net sales have grown by 172 € and by 14,3%, while average net price has grown by 0,23 € and by 3,9%.
Now let’s analyse what factors and to what extent have impacted such evolution of net sales and average net price.
Step-by-step solution
Step 1. Volume effect
We will consider volume as a first factor. To calculate the impact of volume variance, we will eliminate all other factors (here – mix and price). So, let’s assume that only volume has changed, which means that total quantities have increased by 10 units and by 10%, while mix of products and prices remain the same.
To be clear, the same mix of products means that the share of each product in total quantities remains the same as at the period N-1. In our example, if the share of product A remained 50%, its quantities N would be 110 units (50% from 220 units = 110 units). In other words, if quantities of each product increased by the same percentage (+10% in our example), then there would be no mix effect.
So, at Step 1 we have: quantities N recalculated so that the total amount equals 220 units and products’ shares correspond to N-1; net prices N-1. By multiplying these quantities by net prices, we can calculate net sales at Step 1.
The difference between net sales at this step and net sales N-1 is volume effect (in values and in percentage).
Net sales have increased by 120 € and by 10% due to volume effect. As for average net price, it hasn’t changed.
Step 2. Mix effect
The next factor is assortment mix. To calculate the impact of mix variance, we will keep in mind that volume has already changed at Step 1, prices haven’t changed yet. We will take actual quantities of all products at the period N with their actual shares and net prices N-1 to calculate net sales at Step 2.
The difference between net sales at this step and net sales at previous step (Step 1) is mix effect (in values and in percentage).
Net sales have increased by 120 € and by 9,1% due to mix effect. Average net price has also increased by 9,1% due to mix effect (even though prices for each product haven’t changed yet).
Step 3. Price effect
Now it’s time to change net prices. Net sales at this step are equal to net sales at the period N.
The difference between net sales at this step and net sales at previous step (Step 2) is price effect (in values and in percentage).
Net sales have decreased by 69 € and by 4,8 % due to price effect. Average net price has also decreased by 4,8 % due to price effect.
Results interpretation
We have calculated the impacts of all 3 factors on net sales. Please note that at each step net sales at the current step are compared to net sales at the previous step (not to net sales at the period N-1).
To summarize, total net sales have increased by 172 €, of which +120 € due to volume growth, +120 € due to positive mix effect and -69 € due to negative price effect. In percentages: net sales have grown by 14,3%, of which +10% due to volume, +9,1% due to mix and -4,8% due to price effect.

Volume: Volume effect (+10%) corresponds to total quantities evolution (220-200)/200*100%=+10%.
Mix: Positive mix effect on sales means that the share of more expensive products has increased (Product A).
Price: Price effect can also be called the weighted average price change of a portfolio of products (it takes into account the shares of products in total sales). In our example:

Concerning average net price, it has grown by 0,23 €, of which +0,55 € due to positive mix effect and -0,31 € due to negative price effect. In percentages: average net price has grown by 3,9%, of which +9,1% due to mix and -4,8% due to price effect.

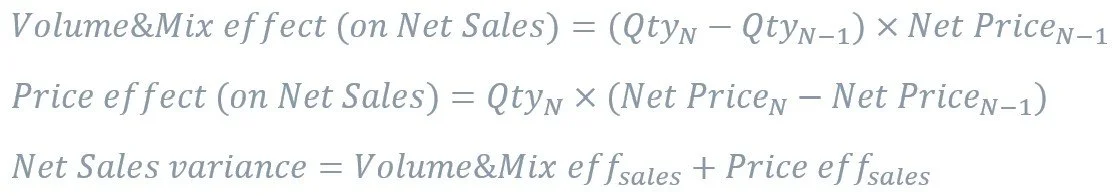
Factor analysis Of Net Sales – formulas

From the step-by-step solution above we can derive the following formulas for further quick and easy calculation of effects on net sales.
Effects on Net Sales (in values)

Where

represents theoretical quantities, that is, quantities at the period N which would be if shares of all products remained the same as in period N-1.

These formulas are applied at the level of products, and then effects by products can be summed up to calculate totals and subtotals by product group/line/business unit/etc.
Effects on Net Sales (in percentages)

With the help of these formulas, we can represent the factor analysis of net sales from our example in a more compact way (see Table 4).
Table 4

Note 1: Calculating mix effect on net sales only gives a meaningful result if all products are expressed in the same units of measure (e.g., kilograms, liters, meters) or in comparable pieces. If products cannot be measured in the same units, it is preferable to calculate the combined effect of volume&mix. Below are the formulas.
In values:
In percentages:

Note 2: What factor goes first in factor analysis does matter – the impacts of factors in values and in % will differ depending on the order of factors. Most commonly in our practice, volume goes first, then product mix and finally price. We would recommend following this order of factors unless there are arguments in favor of putting prices first.
For example, if quantities are more “adequate” at the period N-1 than at the current period N due to manufacturing problems, then it can be more relevant to calculate price effect based on quantities at the period N-1, that is, to put price first.
FACTOR ANALYSIS OF COST OF SALES
Next, we move to the factor analysis of cost of sales (sheet “Part1_COS” in Excel file). The calculation of effects on COS and their interpretation are identical to the analysis of net sales variance. The only difference: net prices are replaced by costs per unit, as shown below.

Effects on Cost of Sales (in values)

Effects on Cost of sales (in percentages)

You can find the factor analysis of COS from our example 4 in a compact way in Table 5.
Table 5

Note 3: If products are measured in different (=incomparable) units, it is preferable to calculate the combined effect of volume&mix, like it was demonstrated earlier for the analysis of net sales. Below are the formulas for COS.
In values

In percentages

FACTOR ANALYSIS OF GROSS MARGIN
Having considered the rules of calculation to break down the variances of net sales and cost of sales into factors, we move to the analysis of gross margin evolution (in values and in % of net sales).
Table 6

Let’s have a look at Table 6 in which we summarize Net Sales / Cost of Sales / Gross Margin / % of Gross Margin for our Example 4 (sheet “Part1_Margin” in Excel file).
In “Gross margin” section of this table we see that gross margin of a portfolio has grown by 15 € (from 250 € to 265 €) and by 6,1%. However, profitability, or % of gross margin in net sales, (“% of Gross Margin in Net Sales” section) has decreased by 1,5 percentage points (from 20,8% to 19,3%), which can be explained by a lower growth rate of net sales compared to cost of sales (+14,3% < +16,5%).
So, our next task is to explain these variances of gross margin by answering the following questions:
What are the impacts of 4 factors we have already defined – volume, assortment mix, price and cost?
What are the contributions of products – overall and within each factor?
But before, let us focus in more detail on the second point.
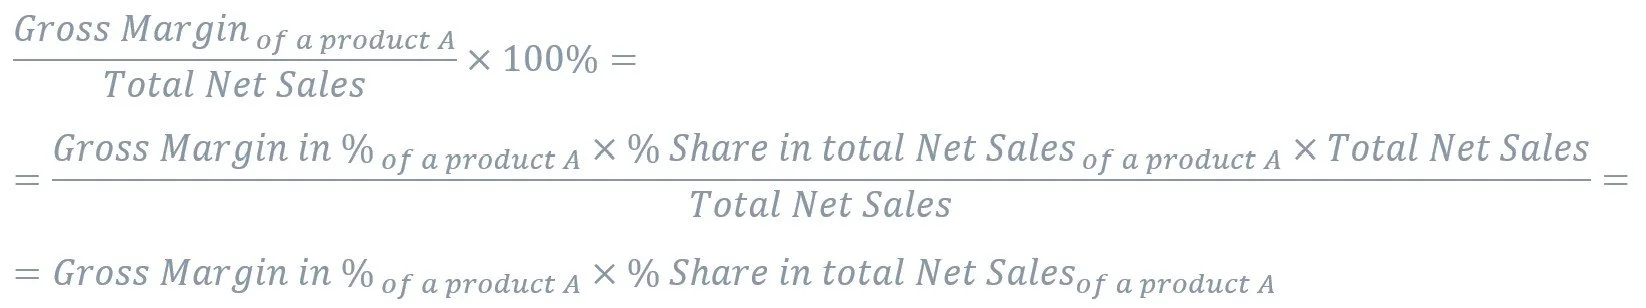
Gross Margin in %. Contribution of products
In our simple example we can evaluate the contribution of 2 products to total variance of % gross margin. In real business cases the same rule of calculation can be applied not only to products but also to any classification of products – by family / segment / product line / etc.
In Table 6 the contribution of products is calculated in the right part of “% of Gross Margin in Net Sales” section, which should not be confused with the evolution of “Gross Margin in %” for each product shown in the left part of this section:

Formulas to calculate the contribution of products:

*This formula is derived from the equation:

Therefore, the contribution of a product A to total Gross Margin in % is:
Factor analysis of Gross Margin – formulas
In Excel file (sheet “Part1_Margin”) you can find a step-by-step solution followed by a summary. Here in the article, we will get straight to the compact solution summary and the formulas behind it – see Table 7.
Table 7

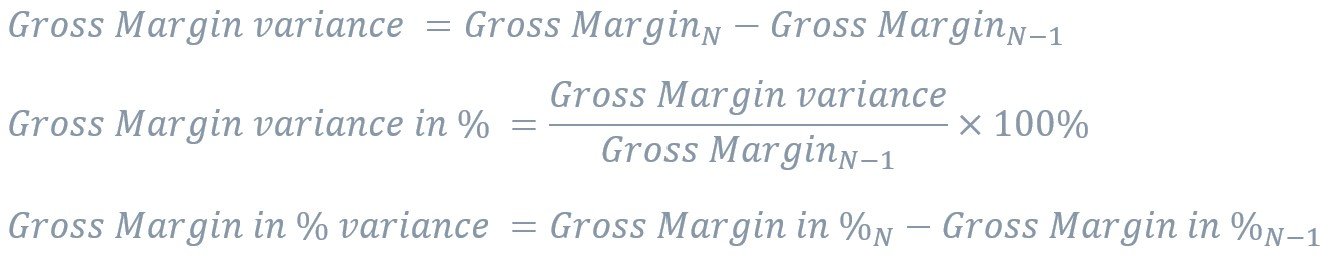
Effects on Gross Margin (in values)

Effects on Gross Margin (in percentages)

Effects on Gross Margin in % (in percentage points)
The effects in percentage points represent the difference of “Gross Margin in %” between the current step and the previous one (“Step-by-step summary” part in Excel file). So, first, below are the formulas to calculate “Gross Margin in %” at each step (in percentages):

And then, formulas to calculate effects on “Gross Margin in %” (in percentage points):

Note 4: Volume effect (on Gross Margin in %) is always equal to 0 percentage points since at this step Net Sales and Gross Margin have changed by the same % (=percentage of total quantities variance).
Note 5: Even if products are measured in different units, “Mix effect on Gross Margin in %” can still be calculated. To do that, volume effect and mix effect on gross margin should be replaced by the combined effect volume&mix, the same way as the effects on net sales and COS.
The formula for Gross margin in % (volume&mix eff) is as follows:

And for Mix effect on Gross margin in % (in pp):

Mix effect is equivalent to Volume&Mix effect because “Gross Margin in %” never changes due to volume effect, as mentioned above in Note 4.
Gross Margin in %. Contribution of products within each factor (in percentage points)
We have already discussed how to calculate the contribution of products to the evolution of “Total Gross Margin in %”. Next, we go further to answer the question: what products have contributed to the evolution of total gross margin in % due to mix effect, price effect, etc.
First, it is necessary to calculate the “Contribution of each product to Total Gross Margin in %” at each step of the analysis (Volume, Mix, Price, Cost), and, second, - the difference of this contribution between the current step and the previous one.

Results interpretation
Below is the illustration of the factor analysis of gross margin (based on Example 4). Charts on the left explain the evolution of gross margin (in values), charts on the right – the evolution of gross margin in % of net sales (in percentage points).

Gross Margin
The overall gross margin has grown by 15 € (from 250 € to 265 €).
Positive factors:
The growth of volume by 10% has naturally led to the increase of gross margin by 25 €.
Slightly positive mix effect of 8 € takes place because the share (in total quantities) of Product A with a higher margin per unit (1,5 € vs 1,0 € of product B) has increased.
The most considerable positive factor is cost effect (+51 €) – thanks to the decrease of cost per unit by 5% of Product A, which accounts for approximately 90% of total COS.
Negative factors:
Price effect has significantly degraded gross margin – by 69 €, of which -88 € is due to the decrease of net price by 7% of Product A.
Gross Margin in % of Net sales
Despite the growth of gross margin in values, overall profitability (gross margin in % of sales) has declined by 1,5 percentage points (from 20,8% to 19,3%).
Positive factors:
The only positive factor is cost effect. The average decrease of costs per unit by 4,4% (of which -5% for Product A and +2% for Product B) has increased total gross margin by 3,7 pp.
Negative factors:
The average drop of prices by 4,8% has degraded total gross margin by 4 pp, which is mostly due to Product A, whose contribution equals -5,8 pp.
Even though mix effect is positive in values, it destructs profitability by 1,2 pts, which is caused by the decreased share of a highly profitable product (Product B).
GENERAL FORMULAS (unlimited number of factors)
So, we have considered a simple example of factor analysis of net sales, cost of sales and gross margin. First, we divided net sales into 3 factors (volume, mix and net price), then cost of sales - also into 3 factors (volume, mix and cost per unit), and in the final step we assessed the effects of all these factors on gross margin by subtracting cost factors from sales factors.
Now let's move on to general formulas that allow us to explain the changes of any indicator by an unlimited number of factors.
The main key points to keep in mind are:
The indicator to be explained must be represented as a product of variables (where each variable is an influencing factor):

If the equation of indicator to be explained doesn’t meet the above condition and contains addition or subtraction, then this equation should be rewritten to split it into several parts (connected by addition or subtraction), each of which contains only multiplication of variables (factors).
An example of such indicator that contains addition is cost of sales split into several components:

And, of course, the most obvious example of an indicator that contains subtraction is gross margin:

Where Net Sales and COS can be represented as a product of multiple variables (as seen in the 1st point for 2/3/4-factors equations of net sales).
Once these two equations are solved and the effects of net sales and COS (in values) are calculated, we can apply the subtraction operation to find the effects on gross margin:

Note: As seen above in the 3rd line of the equation, similar effects (like volume or mix) should be combined to deliver meaningful insights on the variations of the main indicator – gross margin here.
As for the effects in percentages, same rules apply as for an indicator represented as a product of variables.
The order of factors matters and leads to differences in the calculated effects in values, percentages and % points. In our practice the most common order of factors is following:
Volume
Assortment mix
Net sales factors in a logical sequence (e.g., price-list in local currency, then various discounts, then exchange rate, etc.)
Cost of sales factors (starting from the most important ones depending on your business)
However, please note that the above-mentioned order of factors is not mandatory and can be changed if that is required by the purpose of the analysis.
Formulas
1) Indicator is represented as a product of variables (such as Net Sales).


2) Indicator contains addition (such as COS split into components) or subtraction (such as Gross Margin).


2.1) Focus on Gross Margin.


EXAMPLES PART 2
In our second part of examples, we will demonstrate how to use the general formulas when dealing with multiple factors influencing the gross margin. You can find all the detailed calculations in the Excel file (sheets starting with “Part2_...”).
It is worth recalling what effects have already been calculated in Part 1 (Table 8).
Table 8

Equations for Net Sales and COS contain only multiplication, while Gross Margin is the difference between them (contains subtraction of 2 indicators each of which represents a product of variables.

In Part 2, we will break net price effect into two factors: list price and price discount.

The new equation of Net Sales still represents a product of variables, so we can easily estimate the impact of 4 factors: volume, mix, list price and discount.
Next, we will split COS into two parts: materials and value added.

The equation of COS contains addition, and it is necessary to break it down into two equations - Materials and Value Added – both of which represent a product of variables. So, there is no obstacle to calculate the effects of 4 factors on COS: volume and mix (common factors from Materials and Value Added), material cost (from Materials) and value added cost (from Value Added).
Finally, we can explain Gross Margin by 6 factors: volume and mix (common factors from Net Sales, Materials and Value Added), list price and discount (from Net Sales), material cost and value added cost (from COS). See the summary of calculations in Table 9.
Table 9

We let you further explore the formulas and calculations in the Excel file. Below are a few remarks:
Net Sales
o Volume and mix effects return the same result no matter how many factors are taken into consideration.
o Net price effect (-68,5€ or -4,8%) is determined by two negative factors: list price effect (-53,0€ or -3,7%) and discount effect (-15,5€ or -1,1%).

Note: The evolution of an average net price of a portfolio is not a synonym of an average net price change (equal to price effect in %). In our example, net price of a portfolio has increased by 3,9%, even though, on average, net prices have decreased by 4,8% (driven by two negative factors: decline of list prices by 3,7% and a higher percentage of discount given), while the growth is explained by a positive mix effect of 9,1%.
COS
o Volume and mix effects obtained by summing up the corresponding effects from Materials and Value Added return the same result as the equation of COS in Part 1.
o Cost effect (-51,2€) consists of two components - materials cost effect (-24,1€) and value added effect (-27,1€) – both of which have a positive impact on gross margin, since, on average, costs per unit reduce by 3,1% and by 7,2% correspondingly.

Note: The total cost effect in % is not explained by components effects (linked by addition) the same way as net price effect in % is explained by list price and discount effects (linked by multiplication).

However, there exists a logical connection between these percentages of cost effects – we should consider the share of each component in total cost. In our example, materials contribute to approximately 67% (=635/950) and value added – to 33% (=315/950) of total cost.

*To be exact, we need to take the shares of components at the step of mix effect calculation, but for the purpose of simplification we can use the shares of a period N-1.
Table 10

o The above-mentioned cost effects of -3,1% and -7,2% explain the evolution of Materials part of COS and Value Added part of COS correspondingly (see Table 10). In order to explain the evolution of total COS, it is necessary to apply the formulas to the main indicator, as mentioned in the section “General Formulas (unlimited number of factors)” – Point 2.

In our example (see Table 9), COS has decreased by 2,1% due to materials and by 2,4% due to value added, or in total by 4,4% due to total cost.

To summarize, COS has decreased by 24,1€ or by 2,1% because materials costs per unit have reduced by 3,1% on average; and COS has further decreased by 27,1€ or by 2,4% because value added costs per unit have reduced by 7,2% on average.
Gross Margin
o Effects on gross margin are the most representative in values and in percentage points (see Table 9 and chart below). They are calculated according to the formulas described in the section “General Formulas (unlimited number of factors)” – Point 2.1.
o The growth of gross margin in values doesn’t necessarily mean the growth of gross margin in percentage points. Profitability will increase if net sales grow at a greater rate than cost of sales.
o The same is true for evolution of gross margin due to mix effect. Mix effect in percentage points will be positive if the growth rate of net sales due to mix is higher than that of COS.
o Price effect will cover costs variance if its percentage is greater than cost effect in %.
o Price effect in % and cost effect in % are translated into percentage points of gross margin evolution depending on the initial profitability of a portfolio. More details about sensitivity of gross margin to variations of prices and costs – in our article “How (Not) to Lose a Profit in 10 Days?”.

To conclude, here are some practical tips on successful factor analysis:
The above-mentioned formulas to calculate the effects in values should be applied at the product level. Then, these effects should be summed up for further analysis by brand, product type, product line/etc.
The effects in percentages and in % points are of the most interest at the consolidated level.
The source data should be prepared in such a way that all lines in the table are unique. For example:
- If the purpose of the analysis is to compare year to year, then each product should be present in the table with its total yearly volume and not repeated 12 times in case of monthly initial data.
- If a product has changed its ID code in the analysed period or it has several actual ID codes, then this product should only be present in the table once with its unique general ID.
In practice, it is commonly encountered that the offer of products is different between 2 analysed periods. For products which are present in 1 of 2 periods (new or discontinued) we can only estimate volume and mix effects. All other effects are equal to zero. So, formulas should be carefully written to take these cases into account.
Do not hesitate to contact us if you have any questions or comments regarding the article.